Reporting Tools in Oracle Fusion
In today’s day and age with the multitude of information available, organizations depend largely on how strategically they use its financial information both over specific periods as well as in real time.
As companies grow the amount of data handled by their system escalates, resulting in a wider number of users requiring access to this data through management reporting systems.
This in hand increases the complexity of reporting and analysis and the need to get access to up-to-the-minute information to support critical business decisions. Employees, auditors and stakeholders need accurate, up to date and real time information to understand the health and productivity of the business.
This is where fusion financials comes into the picture, not only does it provide the best features to efficiently manage all financial transactions but also has its revolutionary reporting tools which is its stand out feature! Each reporting tool has been tailored to deliver data in a way that’s most appropriate for its given target audience. Whether for management reports, financial analysis, transactional intelligence or statutory reporting.
Fusion delivers various types of reporting tools to meet different reporting needs for different roles. It ensures that all the roles in your company, regardless of the type of report they need, will all be on the same platform.
To know more about Fusion Practices’ Oracle Implementation Services
How does Fusion choose tools according to your users reporting needs?
Fusion Financials provides various types of reporting methods that work off the same standard and multi-dimensional balances. Now because all of the reporting and analytic tools leverage the same source of truth, it ensures that all the roles in your company regardless of the type of report they need will be on the same page.
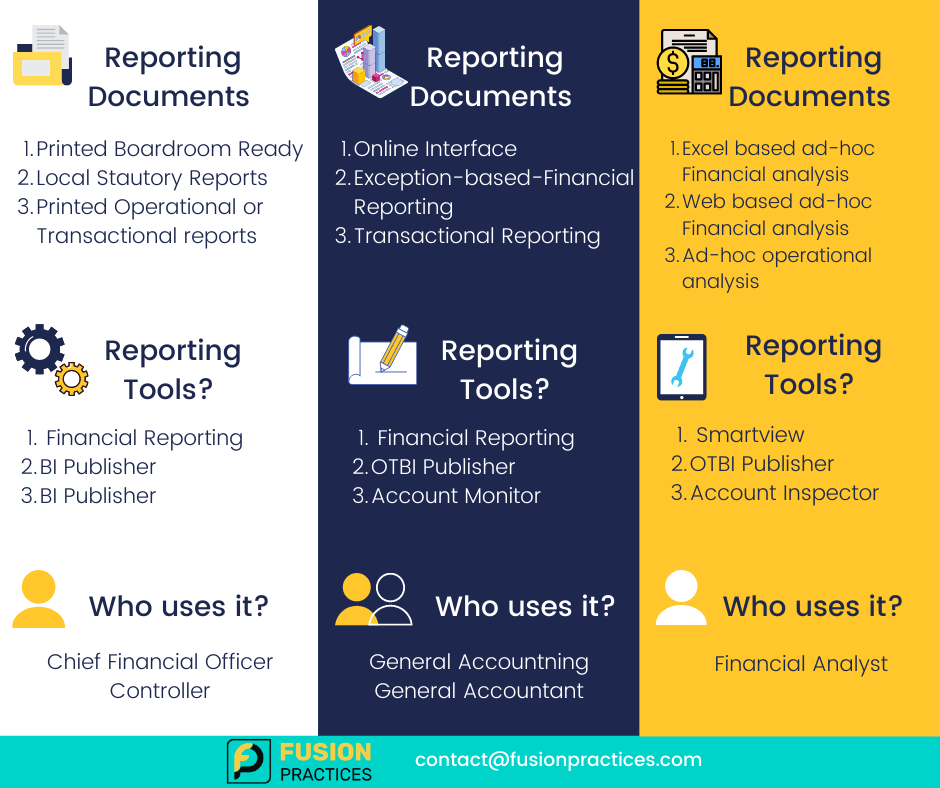
Here you can see three different categories of reporting needs:
- Fixed-Format and High Fidelity reports – Financial Reporting solution can be used to produce boardroom ready financial reports.
- Local Statutory reports – BI Publisher reports can be used.
- Everyday Ad-Hoc analysis – Users can either use Smart View, Account Inspector or Transactional Business Intelligence Reports.
In some cases, the same reporting technology can be used for different purposes too.
For e.g., Financial Reporting solutions can also be used to provide users with interactive reports.
What are the functional elements that make Oracle Cloud Financial Reporting so astounding?
Let’s take a look at what core elements make Fusion reporting so easy to use and efficient:
- Essbase: This Online Analytical Processing (OLAP) server is responsible for extremely fast reports, queries and multidimensional analysis, along with availability of real time data without running any program as the balances are pre-calculated all this through the various end user tools for Oracle Essbase. Business users are enabled to slice and dice data across dimensions and drill up, down and sideways at any parent level.
- Embedded Intelligence: Business Intelligence is embedded directly into business processes via transactional systems so that all business users have complete, consistent and real time information which helps users minimize risks and improves decision-making.
- Trees (Hierarchies): Tree versions in Oracle fusion applications are used to track account hierarchies as they change over time. Using multiple trees enables users to create financial reports for different target audiences. For example- Different hierarchies are used to track cost centers, either by geography or line of business.
- Mobile Reporting: In today’s mobile age data can be accessed securely for mobile reporting. It is easy to access and modify reports and Key Performance Indicators (KPI) through any web enabled device.
Features of Financial Reporting that take care of your reporting needs
- Boardroom ready financial reports: You can use Financial Reporting to produce boardroom ready financial reports displayed on a web page. You can produce snapshot reports with static data, or you can choose to define live reports.
- Real Time Data: End-users can instantly refresh results on-the-fly thanks to all live data that works off pre-aggregated multi-dimensional balances.
- Excel-friendly: Business users can export results to MS Office, such as Word and PPT and dynamically refresh results within those Office products. It is super easy to export results to Excel for further analysis and perform multi-dimensional analysis and drill down to live transactions. It also has the ability to embed charts and graphs.
- Excellent drill down capabilities: End-users can expand on any parent to the next parent level and keep drilling down through multiple levels of hierarchy. This is especially helpful to drill down to detail balances, journal lines and subledger transactions for making important business decisions.
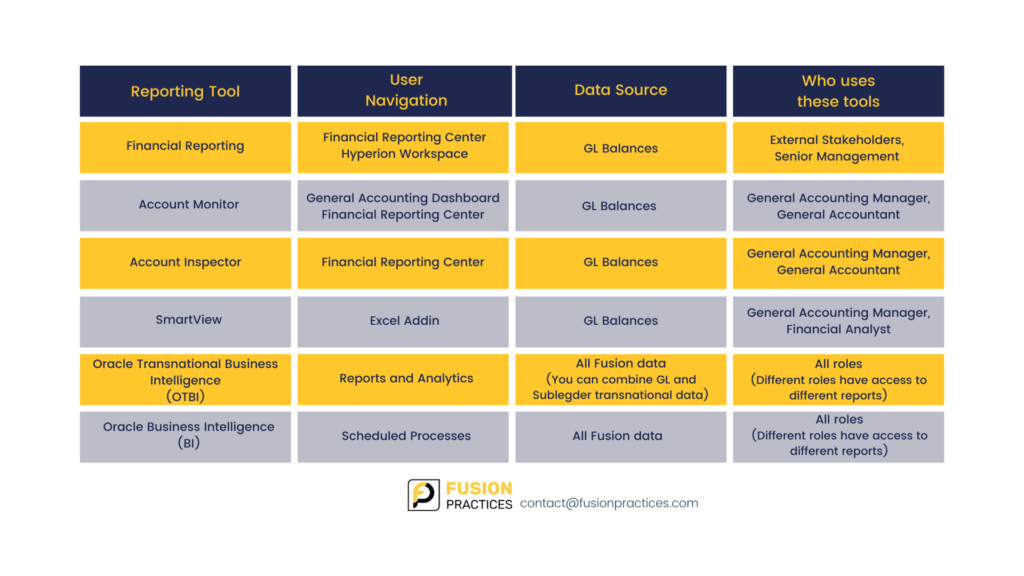
Reporting and Analysis Tools to fit your needs
Now let’s deep dive into these reporting tools that make reporting and analysis efficient and easy.
1.Smart View
Most business users are proficient in Excel and hence Smart View, an excel based utility enables the user to analyse real time GL balances in Excel sheets. These sheets are connected to the Essbase cube directly. Smartview is an ideal tool for financial analysts or power users to pivot across any dimension to perform ad-hoc analysis, add calculations and create graphs using Excel’s built-in functionalities.
It is a very powerful product for EBS customers who can make use of this cloud product without changing their business process.
The best part about Smart view is that it enables you to interactively analyze your balances and define reports using the familiar spreadsheet environment.
- Smart View allows you to move dimensions from page level to row or column, to obtain different views of data, supporting interactive analysis.
- Ad-hoc multi-dimensional pivot analysis combined with full Excel functionality support the following functionalities:
- Facility to drag and drop dimensions to row, column or page
- Perform multi-dimensional analysis, pivot, drill
- Drill from any parent to the next parent level
- Drill down to detail balances, journal lines, and subledger transactions
- Business users can utilize Excel’s built in features (calculations, graphs, etc)
- Users can save reports and queries offline, then later-on reconnect to the live data by opening the spreadsheet.
- Users can email the spreadsheet in order to distribute reports among each other.
- The good news is that, Smart View is compatible with Microsoft Excel, PowerPoint and Word.
2. Financial Reporting Studio
Financial Reporting Studio is the report designer tool or a report repository. It is Oracle’s best client based report authoring tool. It enables users to create customized and view income statements and balance sheet reports.
Business users do not have to run the report, all they got to do is open it and real-time balances are shown automatically. Users can then drilldown from reports to subledger transactions, as well as publish reports in a variety of formats (MS Excel, PDF, MS Word, MS Powerpoint, etc.).
Financial Reporting Studio enables users to:
- Provide object based reporting. Which means nothing but objects are reusable across multiple reports.
- Easy to create reports using drag and drop report components.
- Easy to use objects such as Insert additional report objects (text boxes, images and charts).
- Users can easily insert rows and columns (data, formula, text)
- There are options to select dimension member using member selection or functions
- Like excel users can add calculations or mathematical functions
Similarities between Financial Reporting Studio and Smart View
- Both these reporting centers access the same data source (GL Balance Table)
- You can expand within the report to go to the next level
- You can drill down to get detail balances and subledger transactions
3. Account Monitor
The Account Monitor is itself designed to create active searches. The good news is that Account Monitor has Embedded Intelligence built-in to help you assess the impact of balance changes (favorable vs unfavorable). This in turn makes it a powerful tool for real time, multidimensional account analysis.
Let’s take a look at its awesome features!
- This solves the issues most accountants face, by adopting a Proactive method of monitoring critical balances
- It has user friendly and user-configurable rules and thresholds
- It gives users timely alerts when account balances exceed thresholds
- It provides year over year or actual vs budget comparisons
- It provides the facility to drill down to view break down of balances for each child value that rolls up to the parent value
- It drills down to the subledger level and you can even check the receipts created
- For visual understanding it makes use of graphs and pie charts
This tool is especially useful as it makes sure that any account that exceeds the tolerance limits assigned are automatically displayed, and therefore, result in eliminating any account anomalies from surfacing during your close process and enable accountants to initiate an appropriate business or accounting response to the implicit situation.
4. Account Inspector
This tool is best for users to perform ad-hoc balance queries. It enables them to perform multi-dimensional analysis, slicing and dicing of information, and pivoting– all within a web page.
Why this tool is awesome is because it works off the same analytic cube with pre-aggregated balances at every level so all queries are lightning fast.
How it works is , after you specify your query criteria, such as your ledger and chart of accounts dimensions, you can expand on any parent value to get a breakdown by each child value that rolls up to the parent value. Again, because this query is working off of the same live, pre-aggregated data, you can change query criteria and instantly refresh results, which is what every business user wants.
We can also drag and drop the page level dimensions to further slice and dice results for further analysis.
To summarize its key features:
- It provides interactive ad-hoc inquiries on a web page
- Let’s users Expand and collapse parent values easily
- Enables dimensions to be shifted from page to row or column to obtain different views of your data.
5. Oracle Transactional Business Intelligence
OTBI is a fusion specific reporting tool , used by top level managements of organizations without the need for any technical knowledge. It is a flexible and easy to use analysis tool that helps gain real time insight into transactional data.These features make it extremely valuable to the top management.
Key Features of OTBI
- It is a real-time online reporting tool querying directly from Fusion Application data.
- This is an ad hoc analysis tool based on transactional data focused on operational and transactional reporting.
- This tool requires no separate data warehouse as it uses Fusions database, which explains no ETL process needs to be run to populate any data warehouse.
- Business users can easily create reports and dashboards through personalization.
- It focuses on transactional and operational data such as invoices, payments and assets.
- In OTBI, instead of constructing a SQL query, you can simply drag and drop selected data from subject areas and use different graphical views.
- Users can create out of the box reports (e.g reconciliation reports).
- The more commonly used reconciliation reports are receivables to GL recon report and payables to GL recon report.
- In OTBI, instead of constructing a query, you can simply drag and drop selected data from subject areas using different graphical views.
- This brings us to the good news that even end users can use this tool. No technical knowledge is required.
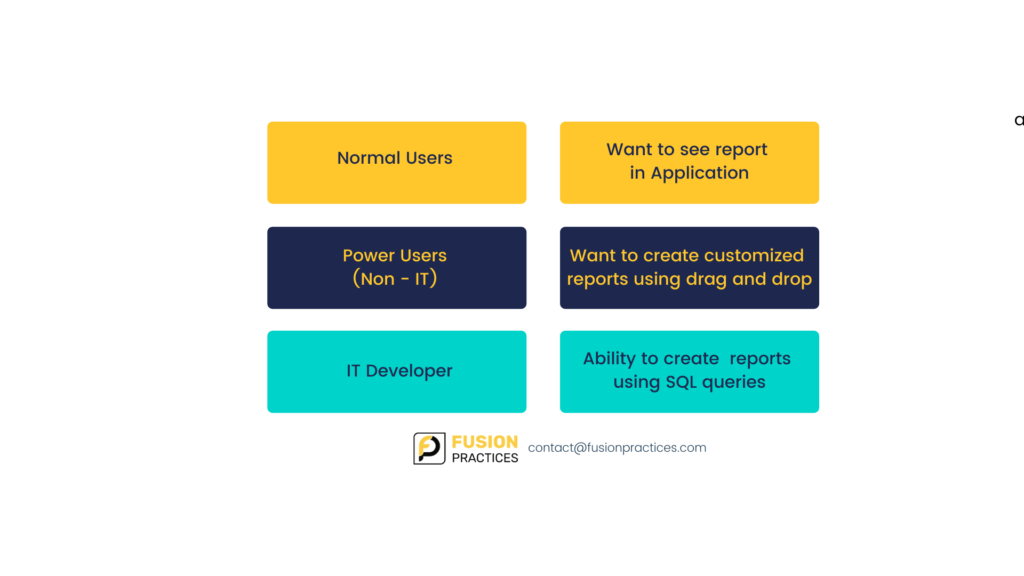
How OTBI caters to all level of users?
6. Oracle BI Publisher
BI Publisher has the following features:
- It helps to author, manage and deliver document reports
- The reports created here are out of the box operational reports
- BI Publisher provides high fidelity, pixel-perfect documents
- They generate high volume transactional and operational printed reports
- It has flexible and customizable output formats: excel, pdf, doc and html
We all know that we can create amazing reports using these Fusion reporting tools, let’s look at how we can secure these reports so that only designated users can have access to these reports.
How does Fusion ensure Report Security?
1.Report Security: When a user adds a report in the repository, by default only that user and the administrator can access the object. Other users need to be assigned access before they can see the report, hence minimizing any leakage of sensitive financial information.
2.Folder Security: Now on a more granular level, you can even secure your folders. You can create folders to organize reports in the repository. Users with access to a folder can access all reports in the folder.
3.Data Security: In addition to the above, data security is also enforced in the reports. Users can only view account balances for segment values that they have access to (through data access set and segment value security).
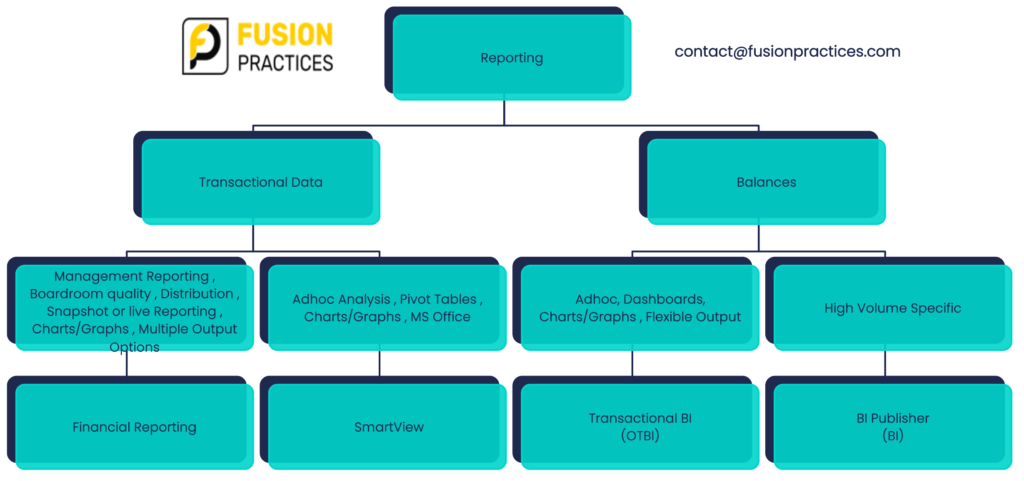
What are the Key differences between various reporting tools?
Financial Reporting/Smart View/Account Monitor/Account Inspector
- Focused on financial reporting and analysis
- Based on GL balances
OTBI
- Focused on operational and transactional reporting
- Based on transactional tables (AP, AR, PO, SLA)
BI Publisher
- Focused on report documents – high fidelity, customizable, and printed
- Based on transactional tables (AP, AR, PO, SLA)
Therefore we clearly see that the reporting tools in Oracle fusion are tailor made to fit the various reporting needs of various roles and user responsibilities. All these tools are available under the same umbrella for all the different roles but keeping in mind the security concerns of these reports. These interactive and user friendly tools is the outcome of Oracle’s huge experience and feedback from its wide ranges of customers throughout the globe & across the industries.